
Oct 15, 2019 | By Rick Stouffer, Editor, Kallanish Energy
NORTH CANTON, Ohio – Drilling in Ohio’s portion of the Utica Shale Play is celebrating a decade of tapping the play’s hidden fossil fuels.
And, while the benefits associated with the play, including created jobs, collected taxes and, for many inhabitants in eastern Ohio, a return to a normal life since many steel mills were shuttered decades ago, are apparent.
But economist types deal in data – hard numbers — the more the better. They want the numbers in front of them before declaring success.
Arrow pointed up
For the 18 counties that comprise Northeast Ohio (aka, NEO), the numbers are in – and the arrow is pointed up concerning how oil and gas is impacting the region.
Iryna Lendel, director of Cleveland State University’s Center for Economic Development, revealed last week oil and gas is now an official part of the economic comeback in NEO, based on 2017 (the most recent) data. She presented from a study she headed that was produced earlier this year.
“This is the first time the oil and gas industry shows up in the data,” said Lendel, addressing roughly 80 attendees at last week’s Utica Summit VII. The one-day program was produced by ShaleDirectories.com and the Canton Regional Chamber of Commerce, on the campus of Stark College.
Trio of GRIDs
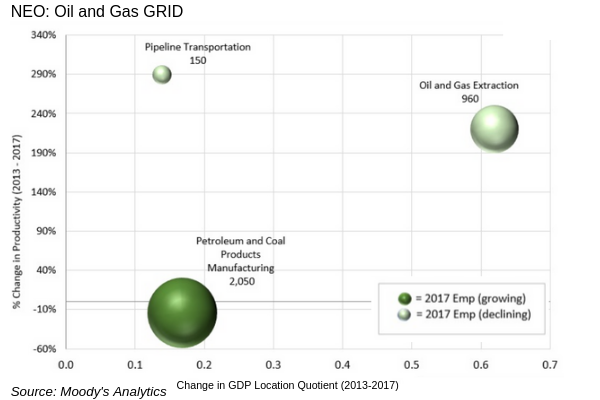
Lendel’s presentation centered on GRIDs: Growing Regional Industry Drivers within NEO. The trio of GRIDs that dominate in the 18 northeast Ohio counties include professional services (71% of GRIDs output), legacy manufacturing (22% of output) and – for the first time the data reveals the oil and gas industry is now 7% of GRIDs output.
While small in percentage, the oil and gas industry is the fastest growing segment in NEO. O&G represents less than 1% of total NEO employment, but 3% of output and 7% of GRIDs output, or $6 billion.
The three industries within the NEO oil and gas GRID include O&G extraction, petroleum and coal products manufacturing and pipeline transportation.
Direct, indirect, induced
“In 2017, oil and gas represented 3,160 direct jobs, an additional 18,945 indirect jobs, and 14,208 induced jobs,” according to Lendel.
Direct employment refers to employment directly related to the production of oil and gas. As a result of this direct employment, employment is also generated in the businesses that supply goods and services to the O&G sector. This is referred to as indirect employment.
Finally, when these directly and indirectly generated incomes are spent and re-spent on a variety of items in the broader economy (e.g., food, clothing, entertainment), it gives rise to induced employment effects.
Akron and Youngstown
Lendel’s PowerPoint presentation centered on two of the four MSAs (Metropolitan Statistical Areas) that are part of NEO: the two-county Akron MSA, and the two-county Youngstown MSA.
Oil and gas GRID industries in the Akron MSA is a bit different than for the entire 18-county northeast Ohio region, including O&G extraction, real estate lessors, offices of real estate agents and brokers, and real estate-related activities. Total 2017 employment from the four sectors was 2,420, and total output was $3.57 billion.
“In the Akron MSA, 26% of growth in economic output from 2013 to 2017 was oil and gas-related,” Lendel told the Utica Summit audience.
Oil and gas GRID industries in the Youngstown MSA include O&G extraction, petroleum and coal products manufacturing, real estate lessors, and real estate-related activities.
O&G extraction in the Youngstown MSA had “exceptionally” high growth in output (275%) and productivity (361% from 2013 to 2017, according to Lendel. Total output of the GRID in 2017 was $2 billion.
“Industries in this grid are small employers, with total employment of 1,260 in 2017,” Lendel said.
Copyright © Kallanish 2019, All rights reserved. Registered in England. Company Number 08582622. Our mailing address is: 1-11 Glenthorne Rd, Hammersmith, London, W6 0LH, United Kingdom